

A link velocity model is a quantitative and behavioral framework used by SEO professionals to measure, forecast, and analyze the rate at which a website acquires or loses backlinks over a given timeframe.
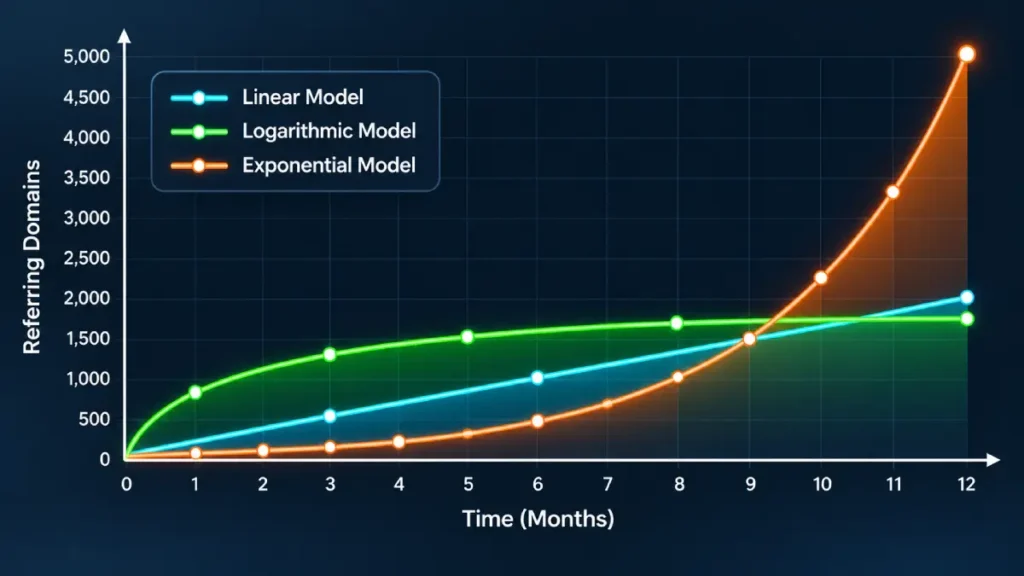
Rather than treating backlink acquisition as a static cumulative count, link velocity models track growth trajectories—such as linear, logarithmic, or exponential curves—to evaluate algorithmic risk, domain authority momentum, and competitive pacing.
By comparing a target site’s acquisition rate against natural industry benchmarks, SEOs can identify unnatural spikes that trigger algorithmic penalties (like Google’s SpamBrain or core ranking updates) or diagnose stagnation caused by insufficient digital PR momentum.
Understanding and implementing these models allows webmasters to align their outreach pacing with organic growth patterns, ensuring sustainable, penalty-resistant search visibility.
1. The Core Mathematical Curves of Link Velocity
Backlink acquisition rarely occurs in a vacuum; it typically follows distinct mathematical distributions when plotted against time. Recognizing which model mirrors your niche is vital for long-term forecasting.
The Linear Growth Model
The linear model assumes a constant, steady addition of referring domains over time (e.g., exactly 15 new referring domains per month).
- Best Use Case: Established enterprise sites with consistent, institutional content marketing and predictable PR output.
- Risk Profile: Extremely low risk of triggering algorithmic filters, but often fails to capture the aggressive momentum required to outrank fast-moving competitors in competitive verticals.
The Logarithmic (Diminishing Returns) Model
In a logarithmic model, link acquisition grows rapidly during initial brand discovery or major product launches, then gracefully flattens into a steady plateau as the site matures.
- Best Use Case: SaaS platforms, venture-backed startups, and newly launched domains undergoing initial authority bootstrapping.
- Risk Profile: Natural and favored by search engines, as it mimics real-world brand attention cycles where initial hype naturally tapers off.
The Exponential (Parabolic) Model
The exponential model features a J-curve where link acquisition accelerates sharply week-over-week.
- Best Use Case: Viral campaigns, major industry research reports picked up by top-tier media, or high-profile news announcements.
- Risk Profile: High volatility. If backed by genuine, earned media, search engines reward the breakout authority. If engineered artificially through PBNs or paid link networks, it triggers immediate SpamBrain devaluation or manual actions.
2. Comparative Breakdown of Link Velocity Trajectories
| Model Type | Growth Rate | Algorithmic Risk | Ideal Site Maturity | Primary Driver |
| Linear | Steady & Constant | Low | Mature / Enterprise | Consistent Content Marketing |
| Logarithmic | Rapid then Plateauing | Very Low | Growth / Startup | Initial PR & Product Launch |
| Exponential | Parabolic / Accelerating | High (if artificial) | Campaign-Driven | Viral Content / Major News |
| Cyclical | Seasonal Waves | Moderate | E-commerce / Publishing | Seasonal Trends & Events |
3. Algorithmic Detection and the “Safe Velocity Band”
Modern search engines utilize machine learning classifiers (such as Google’s SpamBrain) to evaluate backlink velocity anomalies in real time, enforcing strict boundaries per Google’s official link spam policies. Rather than relying on a hard numeric threshold, algorithms look at standard deviation anomalies relative to the niche average and historical baseline.
- Z-Score Variance: If a site’s monthly referring domain acquisition exceeds +2.5 standard deviations above its 12-month moving average without a corresponding spike in brand search volume or organic traffic, the link profile is flagged for manual or algorithmic review using a standard statistical Z-score methodology.
- The Safe Velocity Band: This is a dynamic corridor calculated by measuring top-ranking competitor velocity in the same SERP cluster. Staying within+15% of the niche leader’s organic link acquisition rate ensures maximum growth velocity while remaining inside algorithmic safety parameters.
For a deeper dive into diagnosing structural link issues and evaluating historical risk profiles, and associated backlink auditing resources.
4. Building a Predictive Link Velocity Framework
To operationalize link velocity modeling in your SEO campaigns, follow a structured, data-driven workflow:
- Establish the Historical Baseline: Pull 24 months of historical backlink data using enterprise crawlers (Ahrefs, Semrush, or Majestic). Chart your monthly referring domain growth to identify natural seasonal troughs and peaks.
- Conduct Competitive Velocity Benchmarking: Analyze the top five ranking competitors for your primary keyword cluster. Map their monthly link acquisition velocity over the past year to determine the velocity required to close the authority gap.
- Segment by Link Quality Tier: Do not treat all links equally. Build separate velocity curves for Tier 1 editorial links (DR 60+), Tier 2 industry resource links (DR 40–59), and directory/local citations. Unnatural spikes are most hazardous in high-authority tiers.
- Establish Pacing Guardrails: Set monthly caps and floors on outreach campaigns. If an outreach campaign yields 50 links one month and 2 links the next, smooth out the distribution pipeline to maintain a coherent narrative of organic brand growth.
5. Mitigating Cliff Drops and Link Churn
Link velocity models must account for link churn—the rate at which acquired backlinks are lost over time due to broken pages, site migrations, or publisher removals.
- Net Velocity Calculation: Net Velocity = Gross New Links Acquired – Lost Links. A positive net velocity is mandatory for sustained rankings.
- Clustering Recovery: Sudden cliff drops in link velocity often indicate toxic network purges or publisher domain drops. Establishing an automated monitoring protocol ensures your net velocity curve does not dip into negative territory for more than two consecutive reporting cycles.